


Dashboards improve distributor visibility
by Rich Vurva
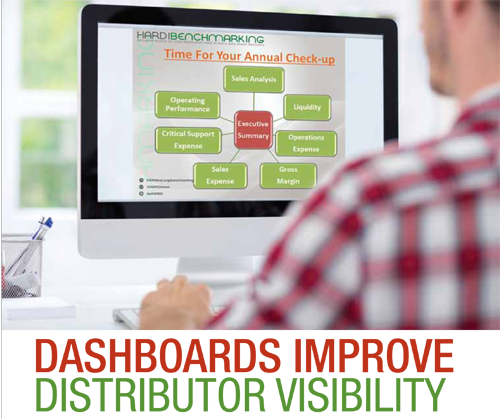
Think of the new Distributor Performance Dashboards (DPD) as a checkup on the health of your business. That’s how Brian Loftus, market research and benchmarking analyst for HARDI, describes the software tool developed by five distributor associations that allows distributors to compare their company’s performance to other distributors.
The program was announced in 2013 by the Heating, Air-conditioning & Refrigeration Distributors International (HARDI); the Industrial Supply Association (ISA); the Power Transmission Distributors Association (PTDA); the International Sanitary Supply Association (ISSA); and NAHAD — The Association for Hose and Accessories Distribution. As the program gains traction, additional distributor associations may be invited to participate.
The software behind the effort was developed by Phocas, a software company that offers a business intelligence solution for wholesale distribution.
The program currently offers participants the ability to analyze company performance in seven different areas: sales analysis; operating performance; critical support expense; sales expense; gross margin; operations expense; and liquidity. An executive summary provides a high level overview of a company’s overall performance.
Distributors complete an online survey, which may take an hour or longer depending on the accessibility of the information requested. Each company’s data is combined into the Phocas software, which calculates ratios that enable comparisons to the median or comparisons to other companies within the same distribution association.
Loftus says the DPD can help companies protect and enhance their profitability and also plan for growth.
“Distributors are in a continual race for efficiency. They’re being pressured all the time, especially with new technology, to find new ways to be more efficient. If you only know how you’re doing, you only know half the score. You also need to understand how you’re doing compared to other distributors,” he says.
How to use the program
The dashboards, or reports, enable a distributor to compare average sales per order to other distributors within a market segment, for example, or to compare their inventory turns to high profit firms. The program was designed with maximum flexibility in mind, so distributors can slice and dice the information in ways that are most useful to them.
Loftus describes one way that a distributor might use information found in the dashboards. Suppose you notice that your company’s operating profitability is better than everyone else. But when you look more closely, you discover that you’re not investing as much in IT as other companies. “Maybe you’re under investing in one area that improves profitability in the short term but may hurt you in the long run,” Loftus explains.
Another user might notice that their company’s operations margin is comparable to the median, but their operating expenses are higher than the median and they want to know why. The other core dashboards allow a user to dig deeper into that specific aspect of their company’s financial performance and the key performance indicators (KPIs) associated with that facet of their business.
“In this case, the user would then open the Operating Expense dashboard and look into details such as staffing expenses and operating expenses to pinpoint exactly where/why they are under-performing. The user can then make a plan to improve this gap and, after participating in the 2015 data survey, can monitor any change in this area of their business,” explains Anna Meyer, director, project management for PTDA.
Participation by distributors is growing at a slower pace than originally hoped, but those who have used the dashboards are responding positively.
“Our members are so busy, it takes a bit of creative marketing to help them understand the value. We know we will see a steady increase in participation as our members hear from their peers about the value of the data,” says Meyer.
Distributors can’t access the dashboards unless they complete the survey, but the five distributor associations make the DPD available to distributors as a membership benefit, with no extra cost to participate. Higher participation results in stronger data.
“We think there are some powerful opportunities here. The trick is to get their attention to explain the value of this program. There is a time effort involved,” adds Joseph Thompson, executive vice president of NAHAD.
 |
|
Keith Nowack, MPT Drives |
Keith Nowak, president of MPT Drives in Madison Heights, Mich., says he prefers working online to retrieve information compared to sifting through a printed report.
“I like it. It has a lot of information that helps me know how I compare to other distributors of my size or even to larger distributors,” he says. “It lets us know if our margins are low compared to everybody else or how my operating performance compares to other distributors.”
Bill Henricks, chief operating officer for DGI Supply in Wheeling, Ill., appreciates having the ability to customize information to suit his needs.
“If you want to segment the membership by size, as an example, you can see how the performance ratio or the expense ratios compare between small companies. Or how small companies differ from large companies or even companies with a higher density of one particular product category. There are many ways to drill into the data from that standpoint,” he says.
Reporting and Analytics Tool
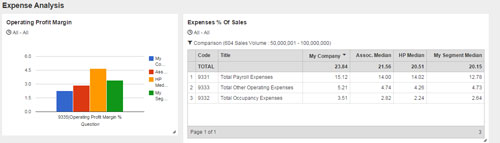
Distributors can perform “apples to apples” comparisons, filtering financial and performance data relevant to them and analyze where they are over- or under-performing against the median and high profit members. “This analysis allows them to identify gaps and consequently make data-driven decisions to develop and implement plans for improvement,” explains Meyer.
Various dashboards focus on key performance indicators. Users can interact with these dashboards, using filters to further analyze why they may be performing higher or lower than their peer group.
Users can create additional dashboards either from scratch or modify existing ones and save as a “favorite” to their personal home dashboard.
Data is presented in informative graphs, which participants can then use for their own internal use. Data can also be exported into Excel and CSV files, which they can use to create or enhance their own internal status reports.
 |
|
Bill Henricks, DGI Supply |
“We’ve spent a couple of years building this model to provide much more capabilities and value for members,” says NAHAD’s Thompson. “It gives distributors greater insights into their company’s own capabilities in comparison to other companies. We’re also going to be phasing in a process to be able to pull data across associations. That will enable, for instance, a hose distributor to see how they compare to a power transmission distributor.”
Thompson added that the DPD can help companies that want to start using data more effectively to improve their businesses. “We’re providing an alternative that gets them robust information that’s easy to use in a program supported by their association so it’s available at no cost to them,” he says.
DGI Supply’s Henricks would like to see the program expanded in the future to include additional operating metrics and key performance indicators.
“Right now it’s principally financial KPIs, things like return on assets, return on equity, and expense ratios related to sales and gross profit. It would be interesting at some point in the future to look at fill rates, customer service levels, phone answer times and things like that. It might be nice to benchmark against that,” Henricks says.
HARDI’s Loftus says the program has enough built-in flexibility that it will be possible to enhance it as participants request new dashboards and other features.
“What we’re doing now will get even better in three months and in six months from now,” he concludes.
This article appeared in the July/August 2015 issue of Industrial Supply magazine. Copyright 2015, Direct Business Media.
INDUSTRIAL SUPPLY MAGAZINE


The March/April issue of Industrial Supply magazine features an in-depth cover story about Joyce Lansdale and Vallen. Plus, we're featuring articles by contributing writers Dirk Beveridge, Frank Hurtte, and David Kahle, as well as interviews with numerous product and distribution industry experts.